Frequently Asked Questions
- How do I access to Tableau Cloud?
Steps to Access:
- Login to Tableau Cloud/Tableau Online https://sso.online.tableau.com
- Type in your complete GWU email address, e.g., UserID
 gwu [dot] edu (UserID[at]gwu[dot]edu). [Use your full email address, not your GWID]
 - Type in your password. Approve sign in request through your Authentication App.
If you see this error message, submit a ticket:
Dashboard & Report AccessAccess to specific dashboards and reports is granted based on a user's role at the University. If you are unable to access a specific dashboard or report intended for your role, access may not yet have been granted. In this case, please get in touch to request access.
Tableau Cloud License Criteria
If you have logged into a Dashboard at least 3 times in the last 3 months, you will automatically be assigned a license on Tableau Cloud. If you get an error or do not have access to the dashboards on Tableau Cloud, please send a Helpdesk ticket to our Business Intelligence team so we can assign a license to you.
Check Status.gwu
Status.gwu.edu provides an easy-to-read overview of the current availability of GW IT services and any scheduled maintenance events. You will find "Business Intelligence Services" under Administration and Services. Check here to see if there is an issue with any of our reporting tools. Members of GW Community have the option to subscribe and receive service status notifications via email, text or MS Teams.
- When is the data refreshed?
The Data Warehouse is refreshed nightly and all of our reporting tools reflect data as of the close of business for the previous day. Here's an example of the data refresh process:
Question Answer What is today's date (example)? 7/1/2024 When was the Data Warehouse refreshed? 7/1/2024 between 12am and 3am The data in the Data Warehouse is as of...? Close of business 6/30/2024 What "Refresh Date" will Tableau Cloud and GW Power BI display? 7/01/2024 between 12am and 3am *Exceptions may occur, subscribe to GW Status to receive email alerts about data refresh disruptions and scheduled maintenance.
- How do I create favorites, subscriptions and custom views in Tableau Cloud?
Tableau Cloud features
- Learn how to create favorites!
- Learn how to subscribe to a dashboard.
- Learn how to create custom views!
The BI Team is here to help! Get one-on-one assistance by scheduling a BI Office Hour!- When do I submit a ticket to Business Intelligence Services?
Submit a ticket to Business Intelligence Services when you are experiencing an issue or need assistance or answers about how to access or use existing BI products, such as:
- Inability to access BIS platforms - check status.gwu to see if there's a university wide issue
- Dashboard or report not functioning properly
- To propose an entirely new dashboard, report or project, or when you are requesting additional data elements or features to be added to an existing BI product
- For non-Business Intelligence Services issues, please visit GW IT Support
- What reporting tools does GW offer and how do I find them?
GW BI currently maintains two reporting tools.
GW Tableau Cloud:
Referred to as "Dashboards". Note: You will need to authenticate using Single Sign On (SSO)GW Power BI
Referred to as "Reports"- How do I find reports or dashboards?
Business Intelligence Services' Content Catalog!
The Content Catalog provides a way to find reports and dashboards across the university's data domains. You will also find the link to our Data Governance Center for the associated business terms. This catalog is refreshed daily as updates and additions are put into Collibra.
See the catalog's glossary of terms.
- What is the difference between CSV and Excel when downloading in Tableau?
When you plan to download data from any GW Tableau Cloud dashboard, you will need to choose between two formats:
CSV Format
Use CSV (.csv) file format (preferred method) when:
- You need every column and every row of data for your analysis.
- The formatting and layout (e.g., predefine groups) are not important.
Note: CSV files can be opened and saved in Excel. Since merged cells are eliminated by the CSV format, you can easily filter and manipulate the data columns. Read more about CSV format.
Excel Format
Use Excel (.xls or .xlsx) format on all other occasions:
- To keep the GW Dashboard data grouping or predefine layout.
- To present data as is or you plan to add charts and visualizations, or any Excel functions
- How do I know which reporting tool(s) to use?
The BI product strategy seeks to serve the majority of user data needs through professionally designed, certified dashboards delivered with Tableau, and the remaining needs with the detailed and build-your-own capabilities of Power BI. Keep this "80/20" guideline in mind when seeking resources for your work, and generally start by seeking to identify the appropriate Tableau dashboard for your use.
You can refer also to the Content Catalog for information such as description, location and business glossary for available reports and dashboards.
- What trainings are available to me?
Our training webpage outlines webinars and training resources for users to become familiar with BI's products and platforms.
- What is Collibra and how do I use it?
The GW Data Governance Center (DGC), often dubbed Collibra in reference to the underlying software platform, serves as the single source of truth for all GW data governance and stewardship activities, and is where business definitions and data assets are catalogued, defined, and governed.
Dashboards and reports created by the BI team are certified in collaboration with the Data Governance team and relevant Data Stewards, and documented within the DGC to ensure all reports and dashboards are consistent, trusted, and high-quality.
We have synced the Content Catalog with the DGC entry for a report, dashboard,and worksheet. You will find a description, glossary of the business terms included along with their definitions, and a link to the asset itself. On certified assets in Tableau and Power BI, you will find a link to the relevant DGC entry.
- How do I navigate a Tableau dashboard?
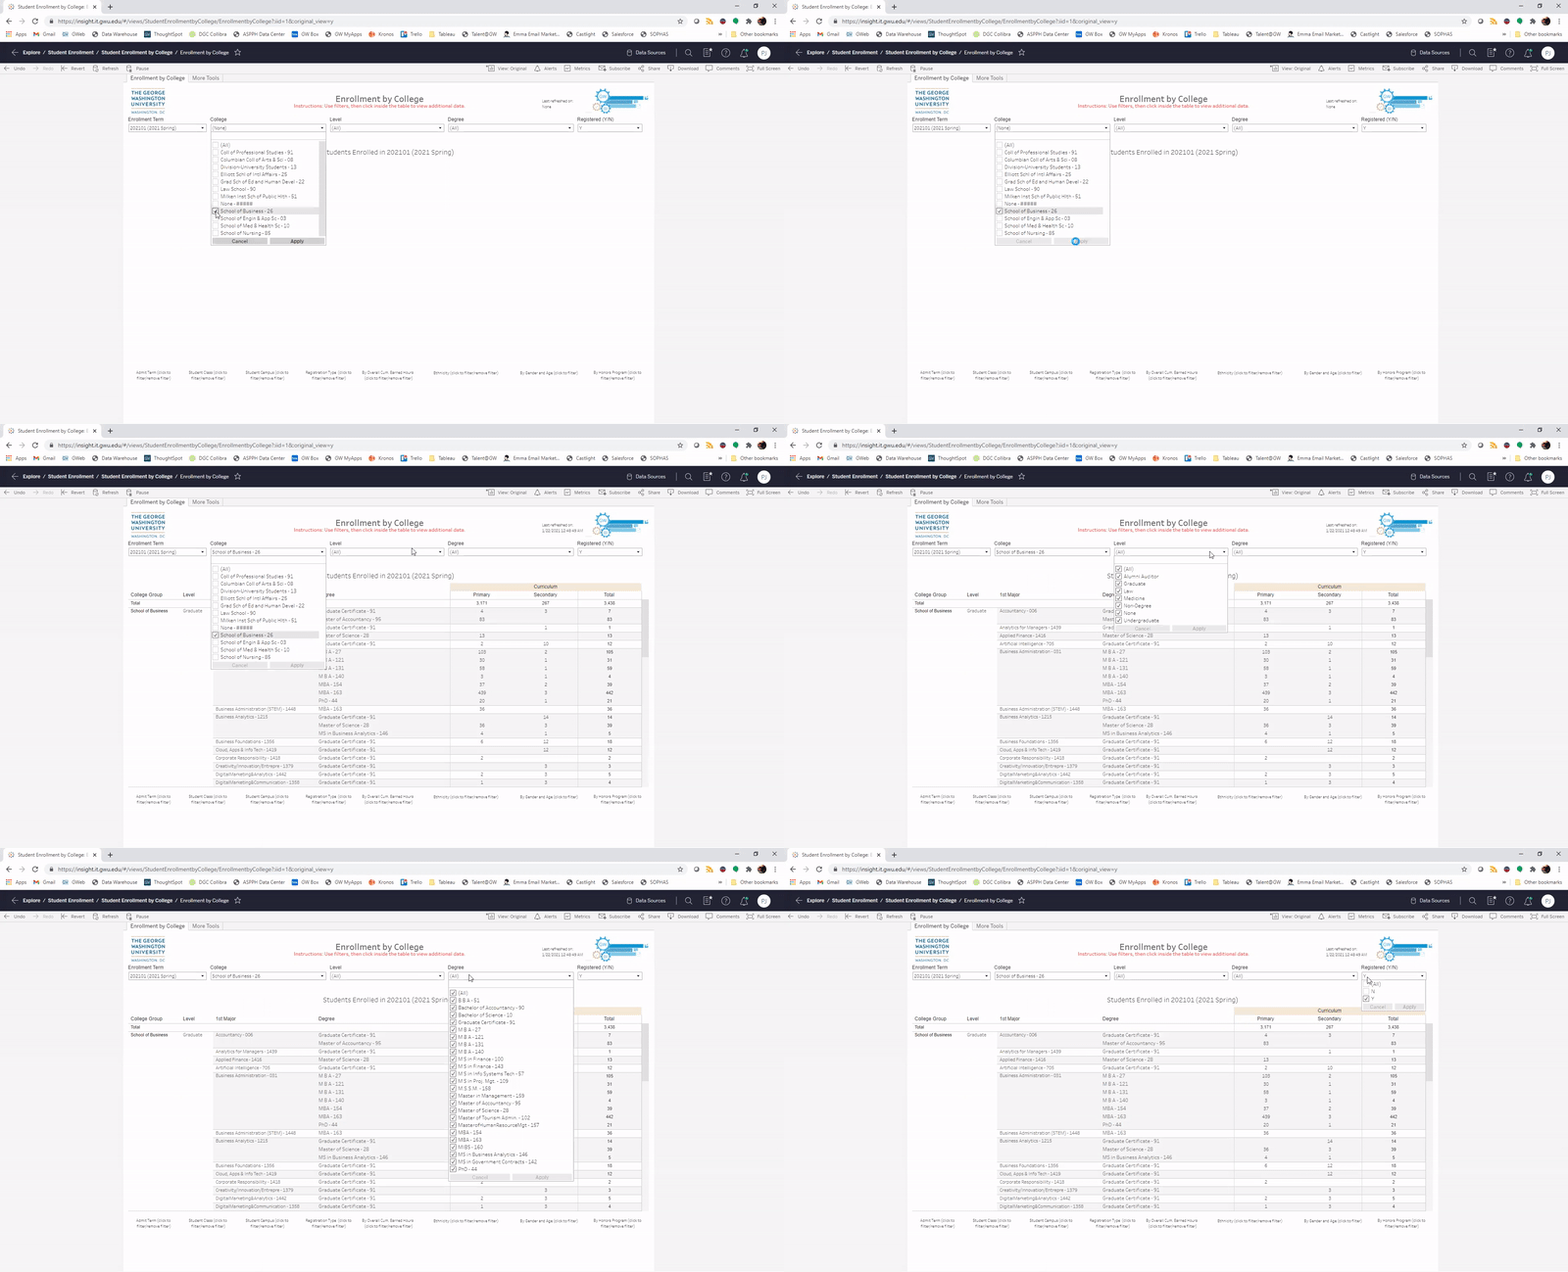
Use the filters at the top of the dashboard to generate or update the summary table.
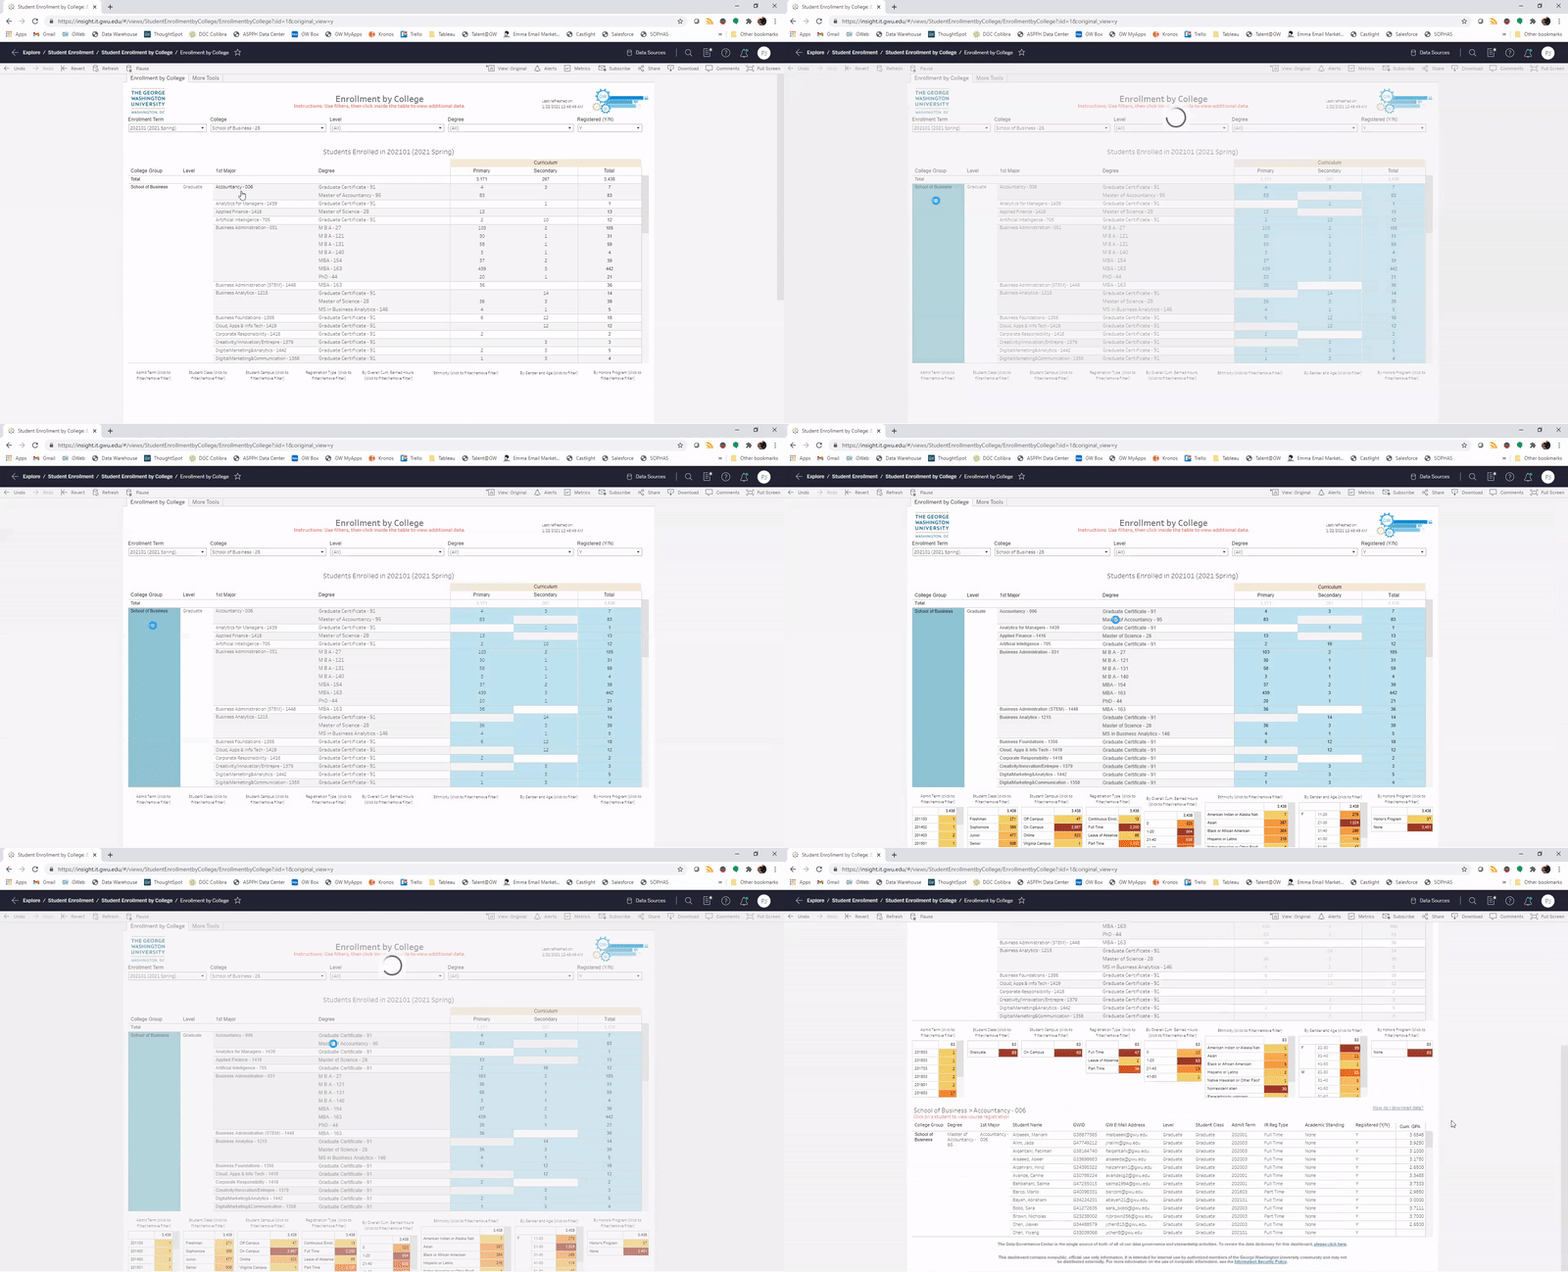
Click on any column, row, or cell in the summary table to generate secondary filters and the detail table (e.g., student level information).
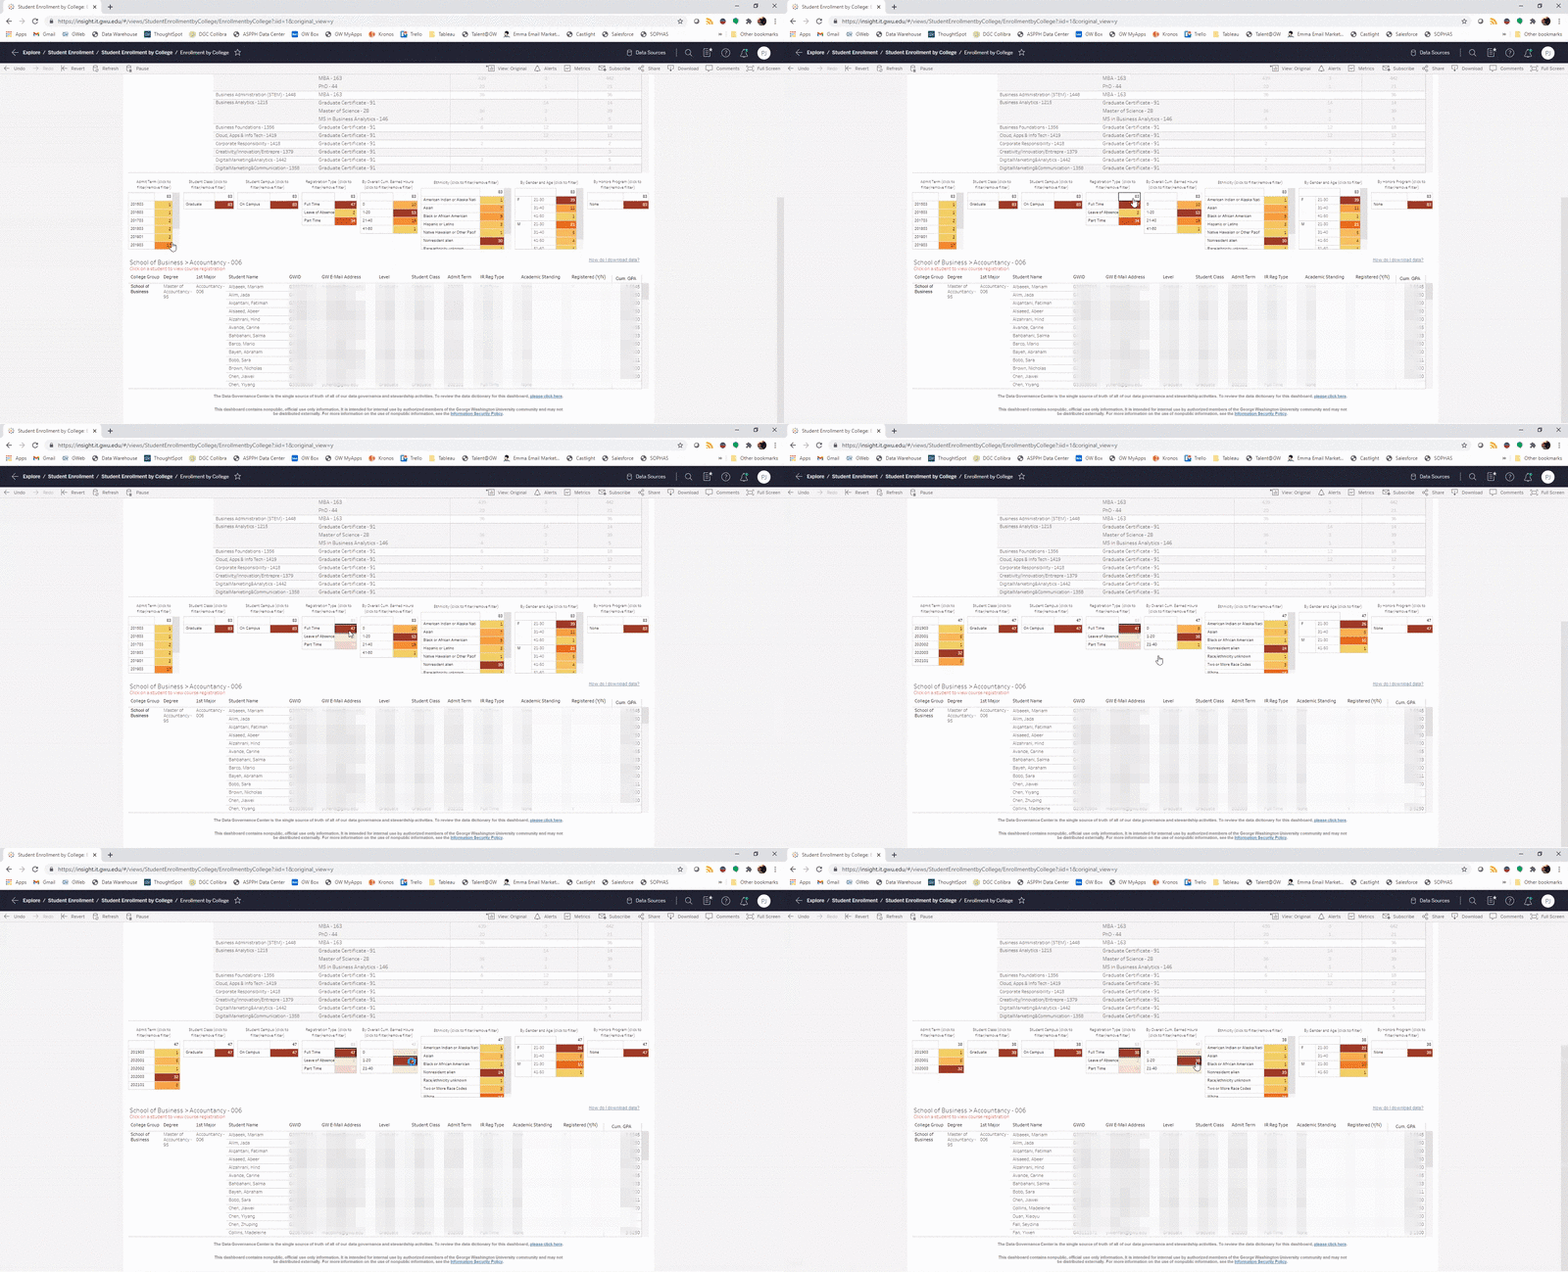
Secondary filters display additional aggregate information. Click on one or more cells to further filter the detail table. Use CTRL + click to select more than one cell from a single filter.
After making all of your selections you can save your view, so it will be available upon next login without having to reapply all filters and selections.
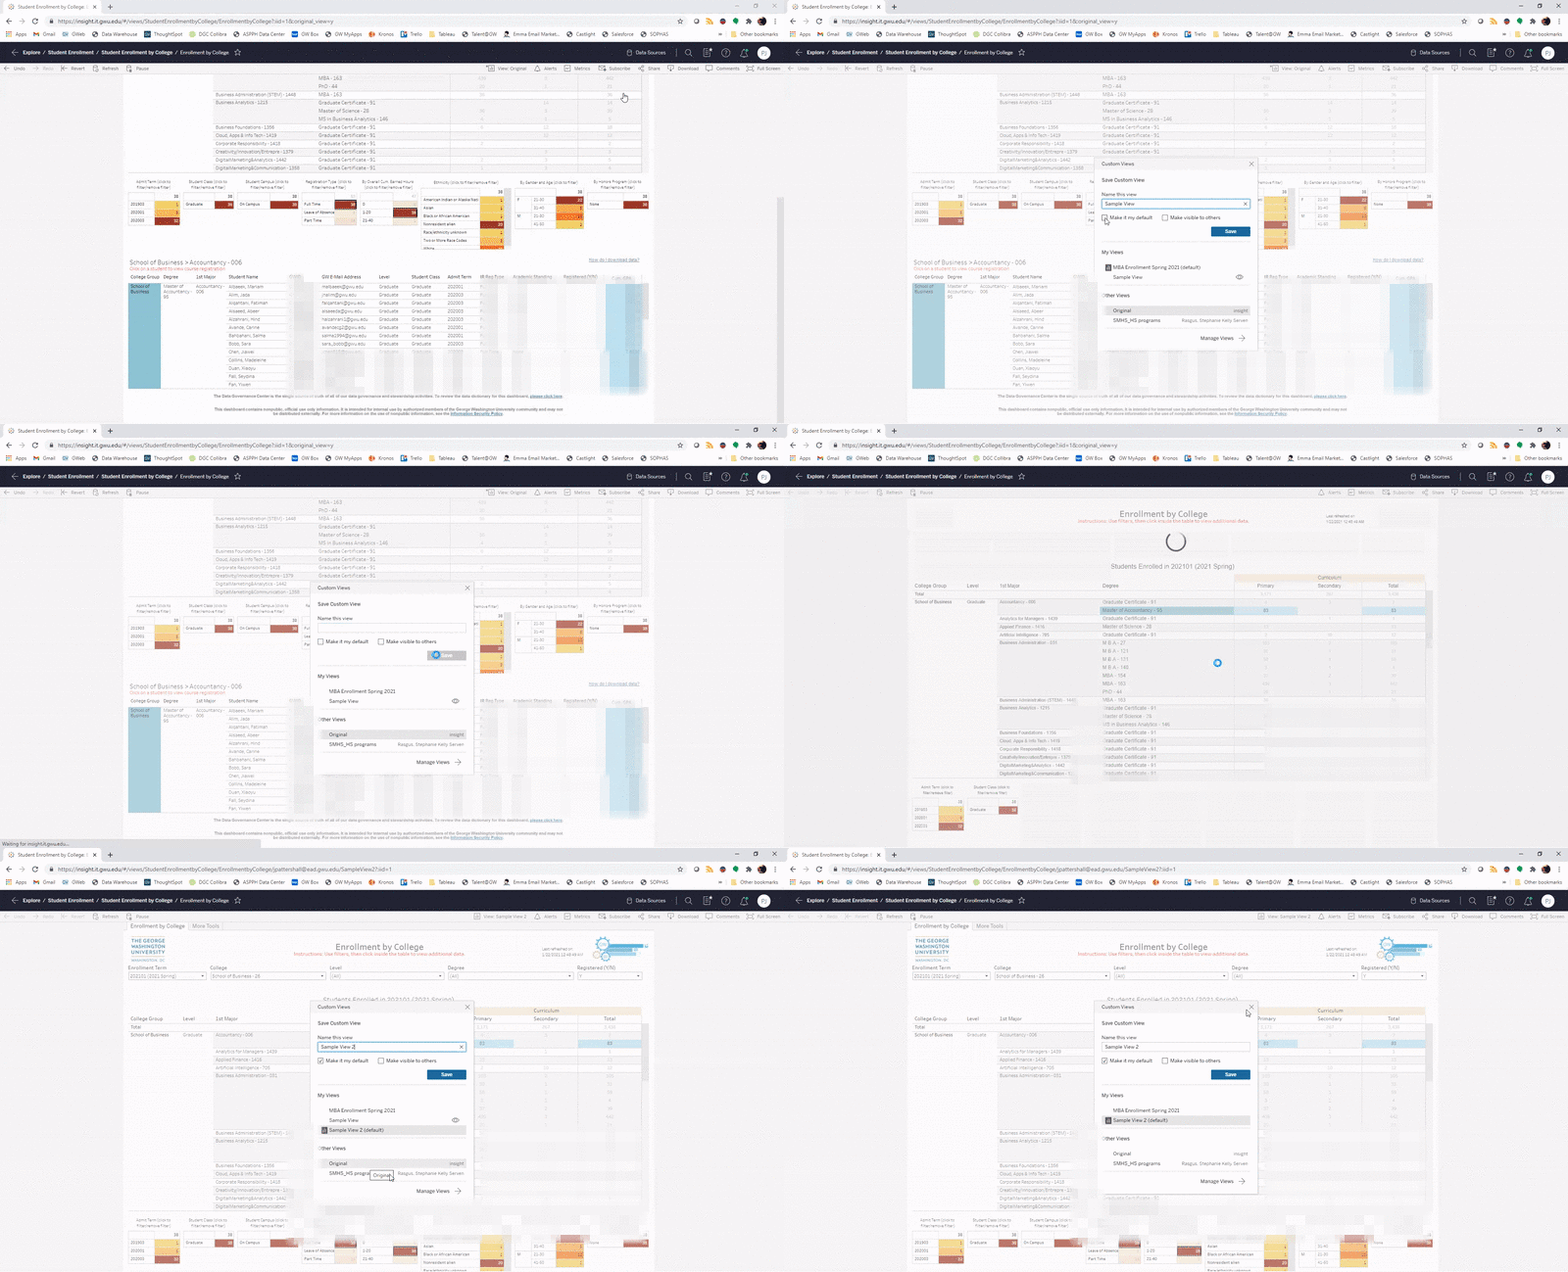
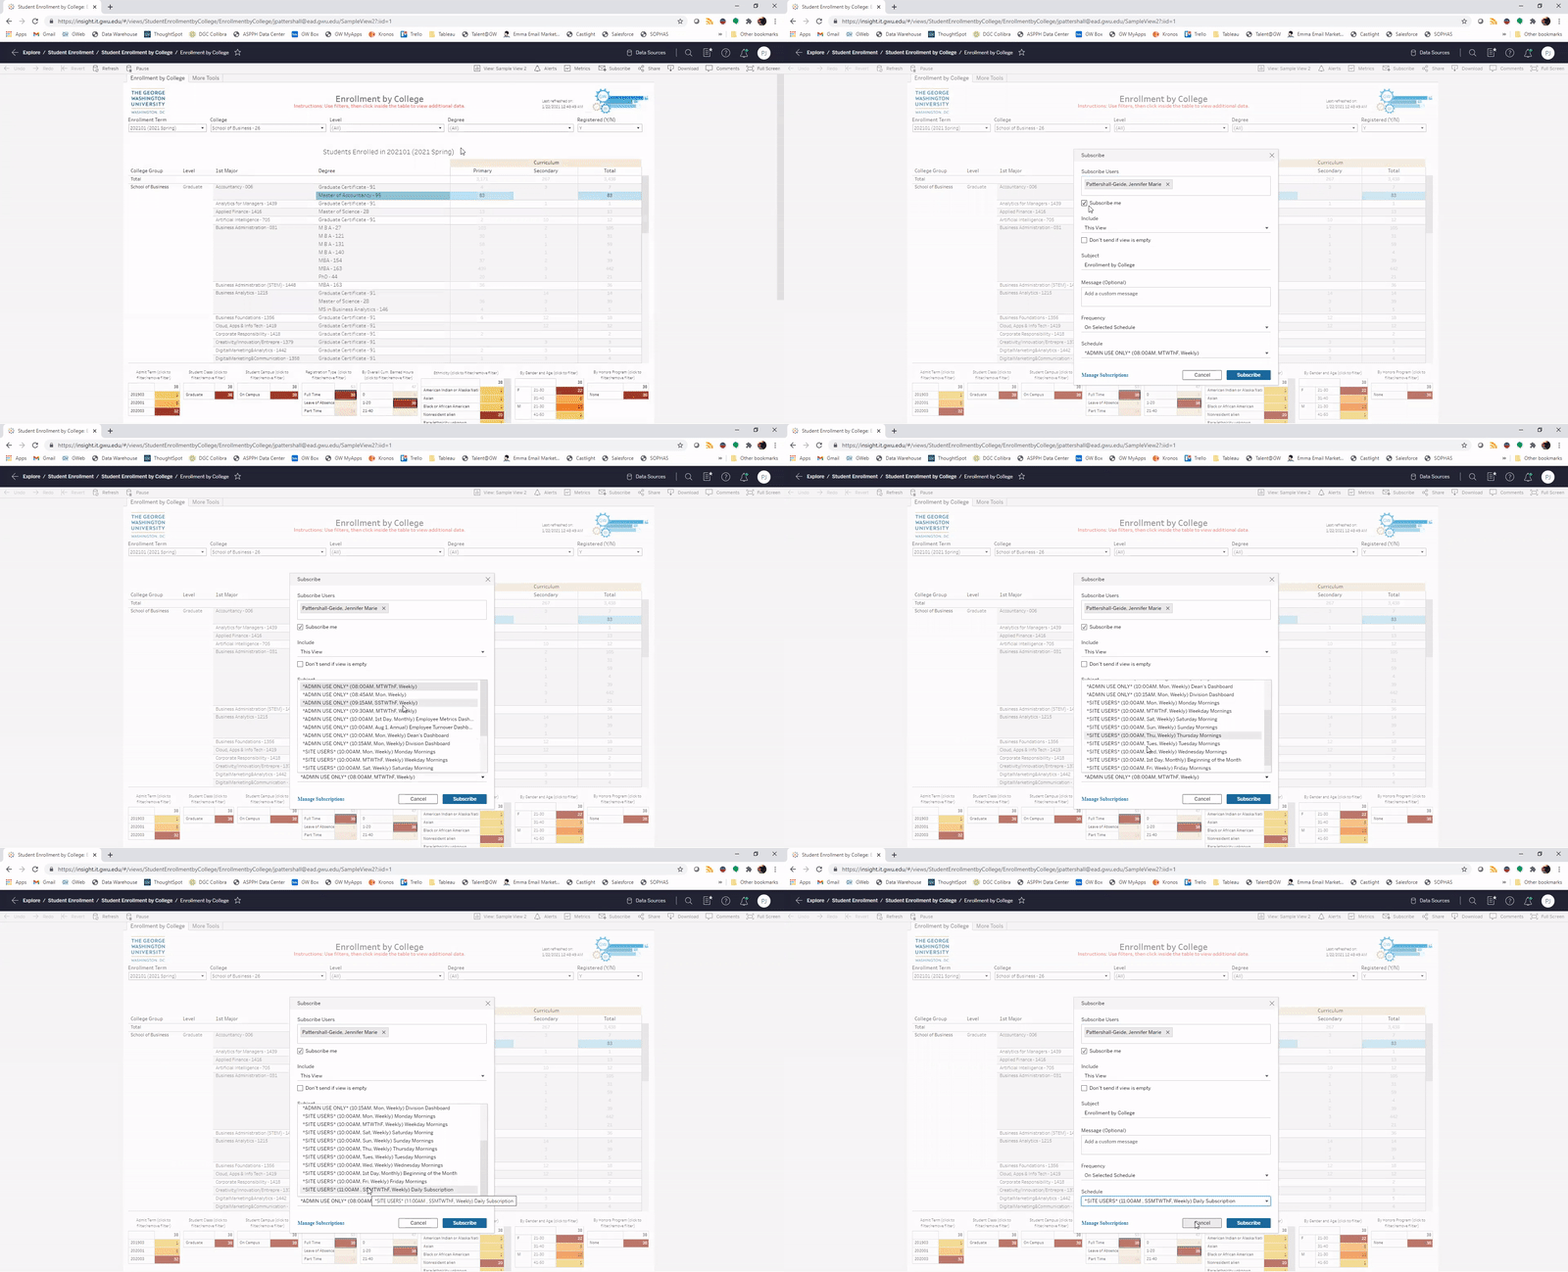
You can subscribe to your view to receive email updates at a regular interval. The email will include an image with a link back to the dashboard. NOTE: Only use schedules labeled *SITE USERS*.
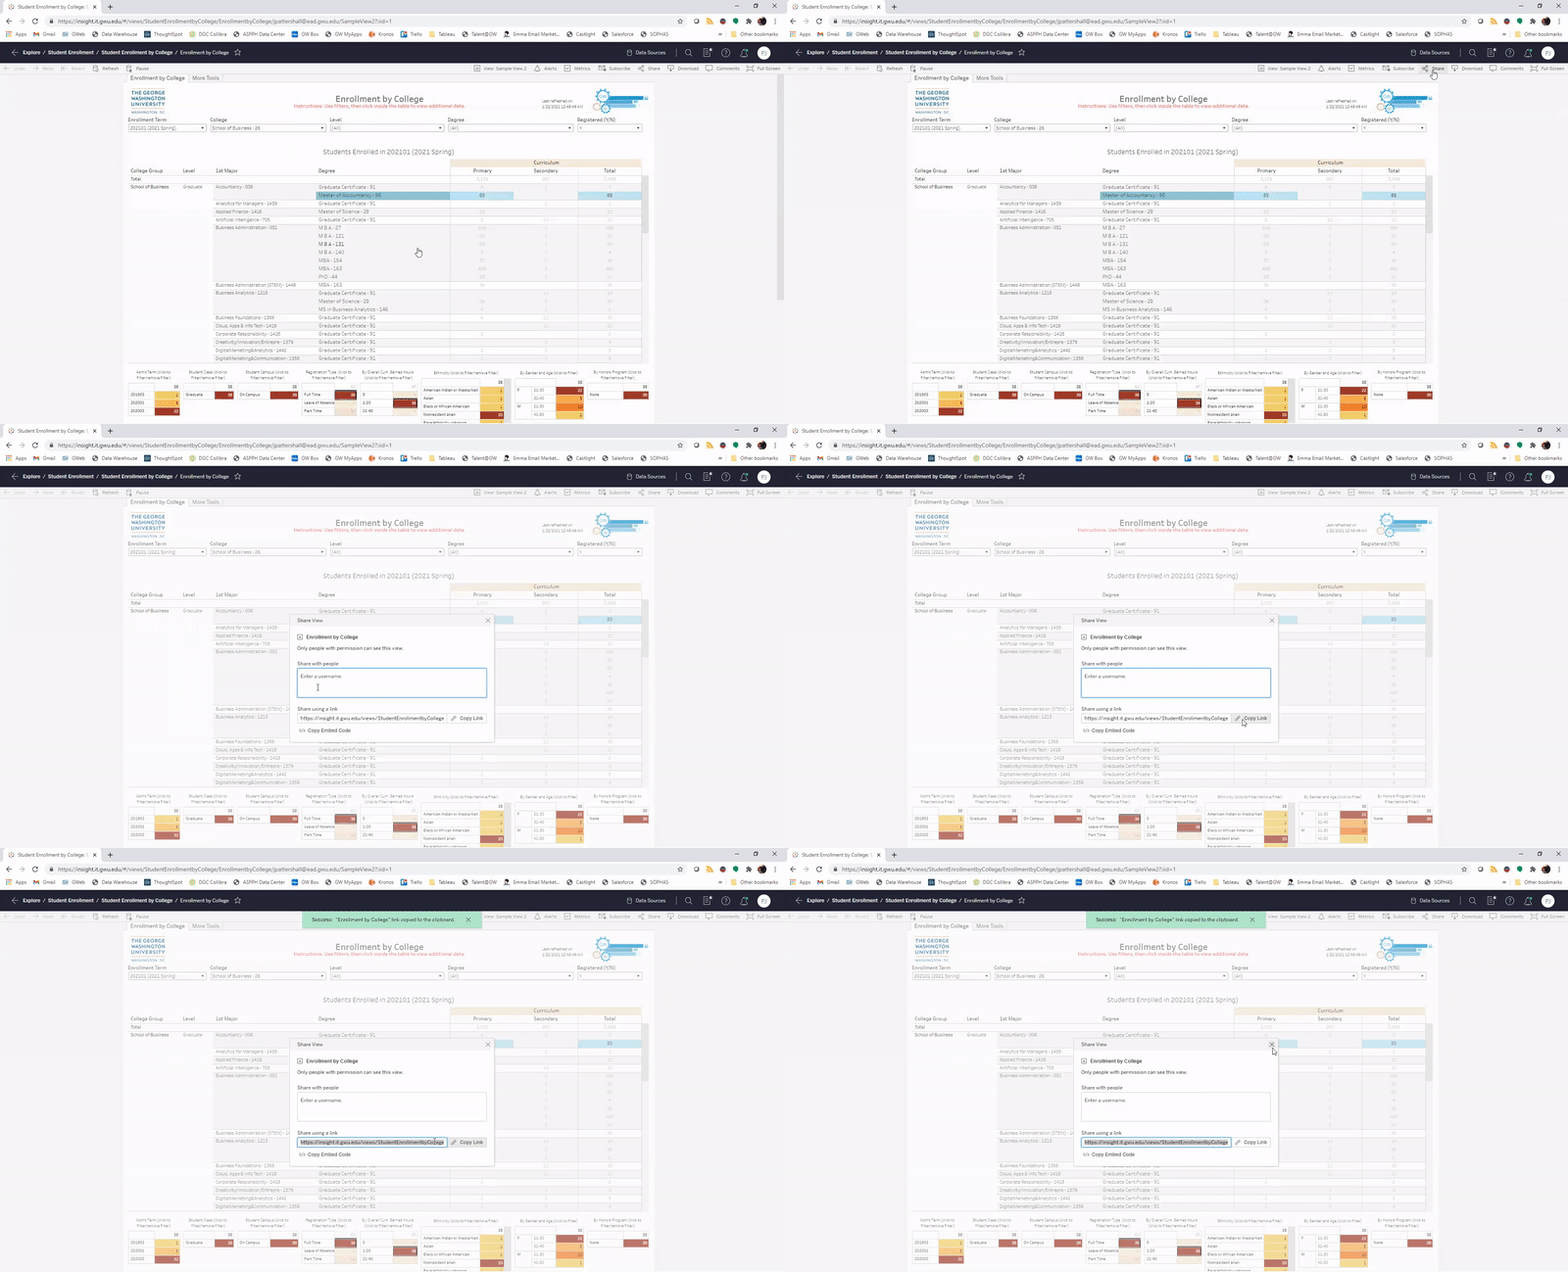
Use the Share option to make your saved view available to others.
- How do I download data from Tableau or Power BI?
Tableau
Dashboards have a "How do I download data?" button which is typically located on the right side just below the dashboard's title.
Power BI
Reports have a button , "Tips and Tricks", beneath the title. This PDF contains step by step instructions to export data.
- What if I don’t see all the data fields I need on a Tableau dashboard?
Download the Table
In a Tableau dashboard not all fields are always displayed in the visual of the detail table, but additional columns are available once you download the table. See tutorial above on "how to download".
Submit a Request
If after downloading there are still columns not present that would be helpful in answering your questions you can submit a ticket. There is no guarantee that the columns will be added.


